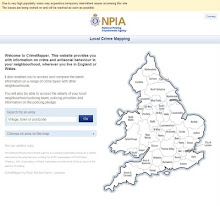

Click on the map above to see full size.
An interactive map offering detailed crime statistics on every street in England and Wales crashed hours after its launch today.
Users in London, Yorkshire, Humberside and Manchester were unable to access the detailed online map.
Those attempting to visit the site, http://maps.police.uk/ were shown an automated message saying it was temporarily unavailable.
The teething problems surfaced as Home Office minister David Hanson officially unveiled the website during a visit to a regeneration project in south west London. He was joined by National Policing Improvement Agency (NPIA) deputy chief executive Steve Mortimore, whose colleagues drew up the map.
The website aimed to offer members of the public unprecedented access to information about crimes taking place in their neighbourhood. The national map follows on the heels of regional versions created by the 43 forces across England and Wales.
Users should be able to access figures on levels of burglary, robbery, violence, vehicle crime and anti-social behaviour. They can also compare one area against another and compare figures against the same period the previous year to see if crime is getting better or worse. The website also offers messages from senior officers and links to local policing priorities and information about forthcoming crime-fighting events.
A Home Office spokesman said: "The high level of public interest in the new national crime map has put temporary pressure on the website. Urgent work is under way to resolve this and the website should be working again shortly."
The launch of the “Crime Mapping” facility, http://maps.police.uk/ unites the crime statistics of the 43 police forces of England & Wales under one software banner for the first time.
This is long overdue. Only yesterday an article posted on this site complained that the Home Office were allowing 8 forces responsible for 40% of the population and 48% of crime to use their own software. Cynical perhaps, but we suspected that this was yet another Home Office strategy to prevent the general public from accessing the full picture of current recorded crime, and also continuing the “fudging” of figures.
After the shaky start when the facility kept freezing up, it started to work more efficiently this evening. We have attached a composite report of the 43 forces current recorded crime for Burglary, Car Crime, Robbery and All recorded crime. On completion, we are not one bit convinced that the police recording of crime is now an accurate reflection of crime in the UK.
• The “All Crime” monthly average for the most recent three months is 357,365 incidents
• On that basis, the full year forecast will be 4,288,380 crimes
• In 2008 the recorded crime incident was 4,703,814 (-415,434)

• This is more than a months full crime reporting for the nation!
• In 2008 as in previous years, the BCS estimates of crime were over twice that of recorded crime
• Front line officers tell us that if anything, the volume of crime is increasing NOT decreasing
• Crimes are often misclassified… robbery downgraded to theft, car theft included in burglary when keys are stolen on egress
• How many crimes are not now reported as such, if the victim does not insist? (Citizen focus?)
• Has public confidence sunk so low that they have simply lost all faith in reporting?
• The BCS last year suggested that reporting had dropped as low as 33% for some offences, to 38% overall
To quote from the Home Office BCS : “For the crime types it covers, the BCS provides a better reflection of the true extent of household and personal crime than police recorded statistics because the survey includes crimes that are not reported to or recorded by the police. The primary purpose of the BCS is to provide national level analysis but some headline figures are available at regional and police force area level. The BCS is also a better indicator of long-term trends than police recorded crime because it is unaffected by changes in levels of reporting to the police or police recording practices”.
• This implies that the Government will place importance on police recorded crime only when it suits them. i.e. If recorded crime shows a decrease, with all the measures introduced to achieve that.
• The table below shows a steady decline in reporting of overall crime in the last 12 years, coincidentally the years of New Labour.
• Does this explain the “gap” of crimes that seem to have appeared in the reduction of reported crime?
• With so many new offences created, we are advised that it is simple to reallocate a reported offence to a lesser category.
• Section 5 Public Order Offences (crimeable) are now commonly demoted to drunk and disorderly (no crime report)
• Of those interviewed by BCS, 76% said they did not report because they felt the police would not/could not do anything
Click on table below to see larger image

• Is that what the CJS has come to, that the public won’t report because they have lost heart?
• Could this be a major contributory factor to the decrease in recorded crime?
• Has the massive surge in bureaucracy resulted in the massive misreporting of crime?
• How timely that the Government have pushed through the alignment of 43 forces data for current crime
• Are they planning yet another media spin about how crime has been dramatically decreased thanks to their effort?
• The recorded crime shows reductions of 5% burglary, 18% car crime, 7% for robbery and overall crime
• The target, performance and senior officer bonus culture will continue to “fudge” until stopped.
• We are guessing that a Home Office release will be imminent.
We wish we could accompany all of this skepticism with a dose of solutions, but unfortunately, we cannot yet see an answer. Clearly, the crime recording system is flawed and unreliable as a measure of crime. Detections are similarly distorted it would seem. It will be a courageous team that arrives at an acceptable solution that will encourage confidence to return, in the face of a Government and senior management teams that will apply many more dirty tricks to keep their noses buried in that trough. The BCS is only based on a trawl of 46,000 members of the public which hardly seems representative.
Dominic Grieve stated it so well. “We would advocate and support the proposal to make crime statistics properly independent. This would remove responsibility for compiling and publishing crime figures from the Home Office. The responsibility should be placed with the Office for National Statistics which is totally independent. The pre-release access that Ministers and political advisers get to crime statistics should be abolished – so the public would be the first to get an honest account of the facts. Any politician can talk about resuscitating public trust”.
The party that demonstrates their intentions and follows it up with decisive transparent and honest action that is genuinely in the public interest, will have the best chance of achieving it.
Crime Analysis Team
Nice 1 Limited