Sunday, 27 September 2009
FREE UK CRIME MAPPING TOOL
Would you like to know what the current crime level is in your area?
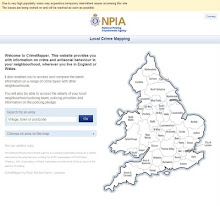
The Crime Analysis Team at Nice 1 Limited are delighted to be share with you, a facility to search the current crime statistics for any of the 43 police force areas of Englnd & Wales.
Click here to connect through to the site housed at the Telegraph newspaper. The link will take you to an interactive map, where you can click the police force area where you would like information. 30 of the forces subscribe to "Crime Mapper" which is a simple crime mapping facility. You will be able to drill down to small areas and see the most recent incident and frequency rates for burglary, robbery, car crime, violence and anti social behaviour.
The sites report whether the areas selected have recently experienced high, above average, average, below average or low levels of crime for the selected offences.
To visit the force mapping sites click a link below :-
Metropolitan
West Midlands
Greater Manchester
West Yorkshire
Merseyside
Thames Valley
Northumbria
Hampshire
Kent
Lancashire
Devon & Cornwall
Avon & Somerset
South Wales
South Yorkshire
Essex
Sussex
Nottinghamshire
West Mercia
Leicestershire
Staffordshire
Humberside
Cheshire
Hertfordshire
Derbyshire
Surrey
Durham
Cleveland
North Wales
North Yorkshire
Norfolk
Dorset
Gwent
Cambridgeshire
Suffolk
Gloucestershire
Northamptonshire
Cumbria
Lincolnshire
Bedfordshire
Wiltshire
Dyfed-Powys
Warwickshire
City of London
At the time of posting this article, some of the sites are having work completed, so a few of the links may not work until the work is complete.
COMMENT
Whilst the information contained on the force sites is a useful guide, it represents only the matters reported to the police and recorded as crime. The Home Office British Crime Survey, which is seen as a more accurate reflection of total crime, reports that crime figures are over double those reported.
So whilst the crime statistics recorded on police force site are a guide, they are not the complete picture, nor do they represent an exhaustive record of crime that occurs. Future posts from these pages will highlight the disparity between the two sets of figures.
It should be noted that the larger police force areas of London, Birmingham, Manchester and Thames Valley, have chosen to use their own crime mapping software. This in itself, obstructs the access of nationwide up-to-date information in identical format. A cynical observation might reflect that this is a means of obscuring the true picture of crime in England & Wales. These forces account for a large percentage of the population and overall crime, so the lack of current data in the same format, thwarts efforts to arrive at the current national position.
Only when all 43 forces operate the same software, will a greater degree of transparency for public consumption will be available.
The Crime Analysis Team
Nice 1 Limited
Subscribe to:
Post Comments (Atom)
Search Site
Our Top 10 Read Posts
-
On a police networking site recently, the above question sparked a mass of interesting responses from all ranks and many from outside partie...
-
A BRICK IN THE FACE OF A BEAUTIFUL GIRL AND WHY WE SHOULD ALL WEEP FOR BRITISH JUSTICE The extent of the damage done to Samantha Frase...
-
Wherever you are Guv, take care & best wishes In a sad indictment of modern policing, one of the best-known anonymous police blogg...
-
In recent years the British people have been increasingly denied their democratic rights. On issue after issue, the views of the majority ...
-
CHRISTMAS! CHRISTMAS! CHRISTMAS! CHRISTMAS! CHRISTMAS! CHRISTMAS! CHRISTMAS! CHRISTMAS! CHRISTMAS! There, we've said it...
-
The Winsor Review team has produced a ready reckoner to show how much you could be winning or losing from its recommendations. We have upl...
-
Hardly surprising that ACPO President Sir Hugh Orde (pictured left above) would vociferously defend the integrity of the upper echelo...
-
Inspector Gadget Following the recent publication of the HMIC report 'Valuing the Police', Policing in an Age of Austerity, reveal...
-
The arrival of a new Liberal/Tory Government committed to opening the books of public sector profligate spending has resulted in Senoir Po...
-
In yet another example of ACPO using the Home Office and the media to deflect attention away from their own nefarious conduct , they subm...


0 comments:
Post a Comment